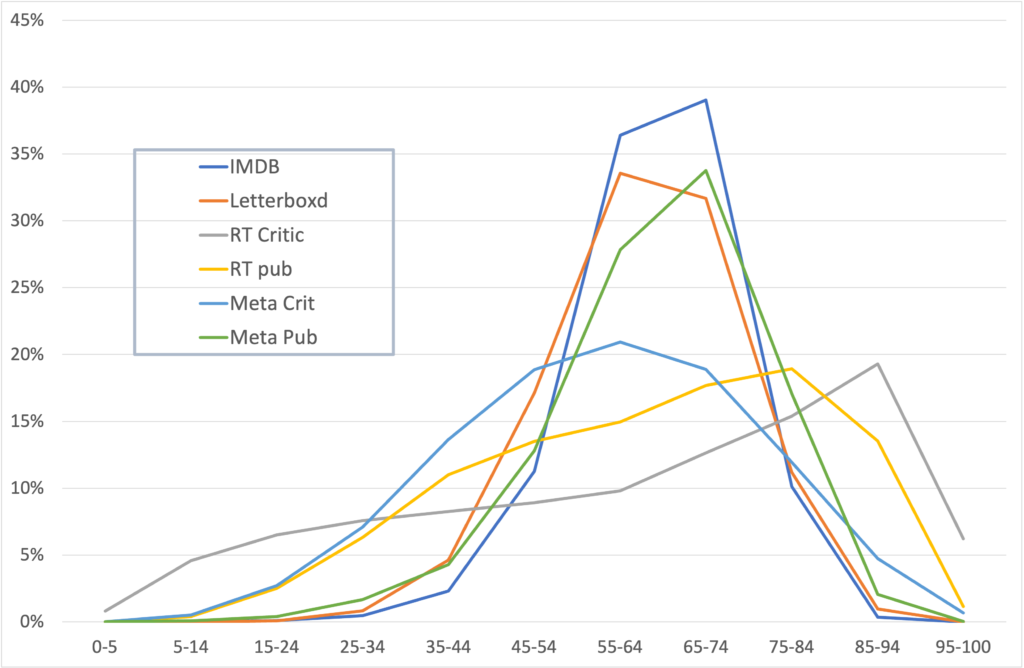
Different series of ratings have quite different distributions of scores. The chart below shows the distribution of each of the of ratings by interval. Ratings are converted to a percent scale by simple multiplication of ratings. For example, Letteroxd ratings, which are on a scale of 1-5, are multiplied by 20. No other adjustments are made.
IMDb, Letterboxd and Metacritic public all have distributions resembling a normal distribution though they are not entirely symmetrical. Median rating are around 65%. Metacritic critics’ scores are also similar to a normal distribution, but with a larger spread (variance) and a lower median at around 55%. Rotten Tomatoes film fans’ ratings are more broadly spread but still rise to a peak in the upper middle part of the distribution.
In contrast, Rotten Tomatoes critics’ scores cluster towards the top end of the distribution. Around 18% of films get 90% or more, and about a third of films score 80% or more. In contrast less than 1% of films in our sample score 9.0 or more on IMDB.
This reflects the binary nature of the ratings on Rotten Tomatoes. The score is the percentage of critics who give a film a favourable. If most critics take of broadly favourable view of a film it will tend to have a high score, even though the reviews are only moderately favourable. Metacritic has a more nuanced scale so fewer very high scores.
This implies a need for caution in interpreting scores from this source. A rating in the mid to upper 90s appears impressive. However, in practice quite a large number of films achieve this, and it may not be as strong an endorsement as at first appears.
Distribution of ratings on a common scale